Nick Larter, MBA (Technology), B.Sc. (Hons) - Technology Troubleshooter
- consultancy and management services in new technologies -
____________________________________________________________________________________________
Apart from being thoroughly versed in the usual systems engineering and management tools, Technology Troubleshooter specialises in the kinds of systems-based analyses which could collectively be called a systems approach to problem solving as first described in the work of people like Checkland at Lancaster in the 1960's and 1970's, and later developed by the Open University amongst others.
Soft Systems Methodology (SSM), Systems Intervention Strategy (SIS) and Hard Systems Approach (HSA) are three labels given to methodologies which take in the latest thinking. In simple terms these methodologies enable three things to be explored - "where we are now" in a situation (such as a policy or programme), "where we want to be" in the future and "how we might get there." - all make use of advanced diagramming techniques. Diagramming is crucial aid to any analysis, enabling complex problems to be unravelled represented with clarity, as a first step to gaining deeper insight into them.
Two examples of diagramming are given in the following sections.
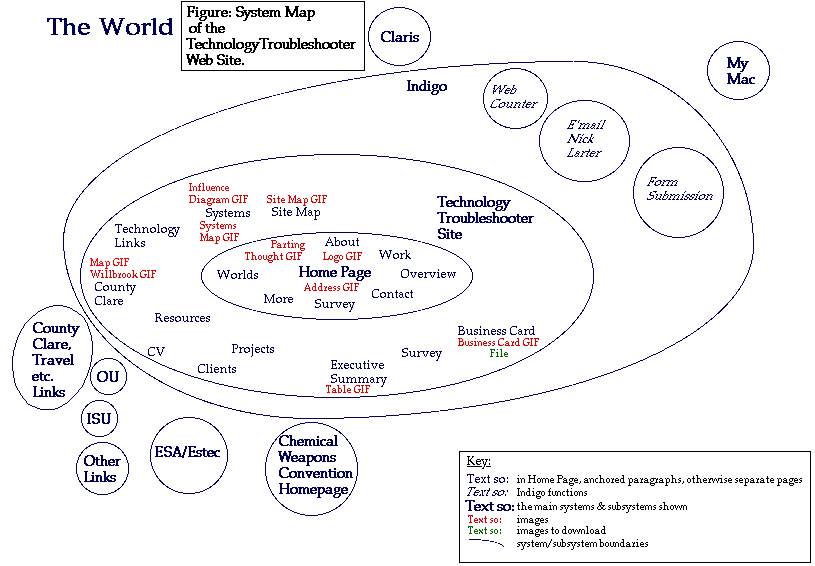
The construction of a system map is a critical first step in any analysis. It enables all of the potential contributory elements of a complex problem to be set out, suggesting which can be discarded as unimportant, which may be at the periphery of interest and which are likely to be central to the analysis which follows. The figure below ought more correctly to show ownership, and be entitled "Nick Larter's System Map of the Technology Troubleshooter Web Site" since a different analyst making the same map might come up with a different picture, due to the expression of their different prejudices or interests. This is more of a problem in soft systems involving human activity, where there are far fewer universally accepted 'correct' answers. A comparatively simple hard system, representing someone's Web site on a server, ought to lead to a very similar end-result, whoever is making the system map. The system map below shows the Home Page and its elements, the other documents on the Web Site and some of the interaction with the Internet Service Provider (ISP), in this case Indigo. The boundary at the Indigo level might be considered to be the boundary of the system. Other systems, OU, Claris etc. are shown outside of this boundary - they are in the environment of the subject system - they can influence it in disparate ways but are not in themselves affected by it.

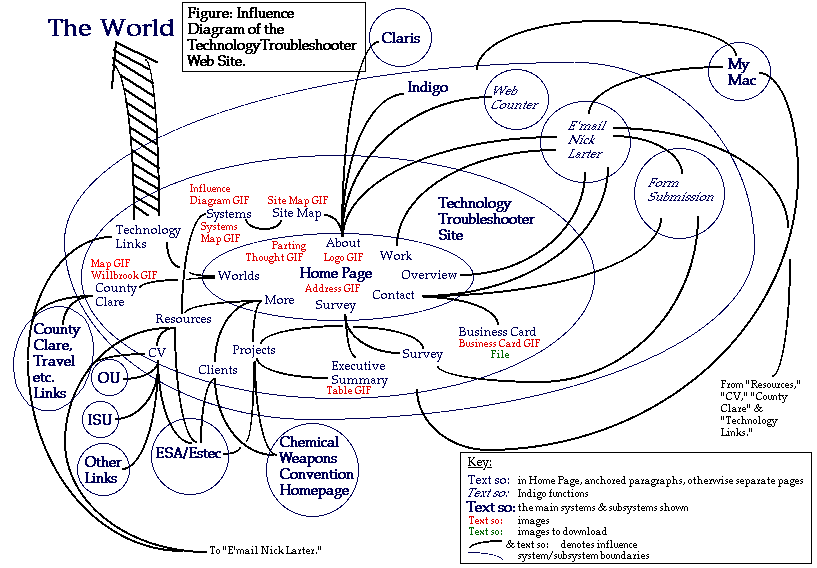
This follows on directly from the System Map. An influence diagram connects different elements of the system and its environment in cases where there are though to be influences between them. At this stage the direction(s) of the influence and what the influence actually consists of need not be shown - this refinement can come in later analyses, normally after focussing on certain parts of the system, which are thought to be of special relevance to the problem under investigation.

A Site Map of the Technology Troubleshooter Web site has been created, based on this Influence Diagram.
Carter R., Martin J., Mayblin B. & M. Munday (1984). Systems, Management and Change - A Graphic Guide. 118 pp. Paul Chapman. ISBN 1 85396 059 4.
Read in a couple of hours. Re-read again and again as the lessons are slowly absorbed.
Checkland P. (1981). Systems Thinking, Systems Practice. 330 pp. Wiley. ISBN 0 471 27911 0.
Charts the history of the 'Systems Movement' and the evolution of analytical techniques up to the beginning of the 1980's. Particular good on the emergence of 'soft' systems and the 'human activity system', including the Schrödingeresque conundrum which arises from the observation of the latter by the analyst.
Return to Home Page
Last update: 19/May/98